Clojure debugging and introspecting Java Code#
One of the limitations of Cider is that it does not support debugging Java(or it is not very easy to do so). This page provides information on how to do that using dap-mode
As a bonus, it will also enable navigation through java code like finding definitions, references, implementations, etc.
Java code navigation#
- Follow the guides on installing
lsp-java. If you areSpacemacsuser you need to add the following layersdap,lsp,(lsp-java :variables java-backend 'lsp).lsp-javaautomatically downloads all required server-side components(JDT Language Server,Java Debug AdapterandJUnit Test Runner). - Go to the root of your project and do
lein pom - Open a file from your project and do
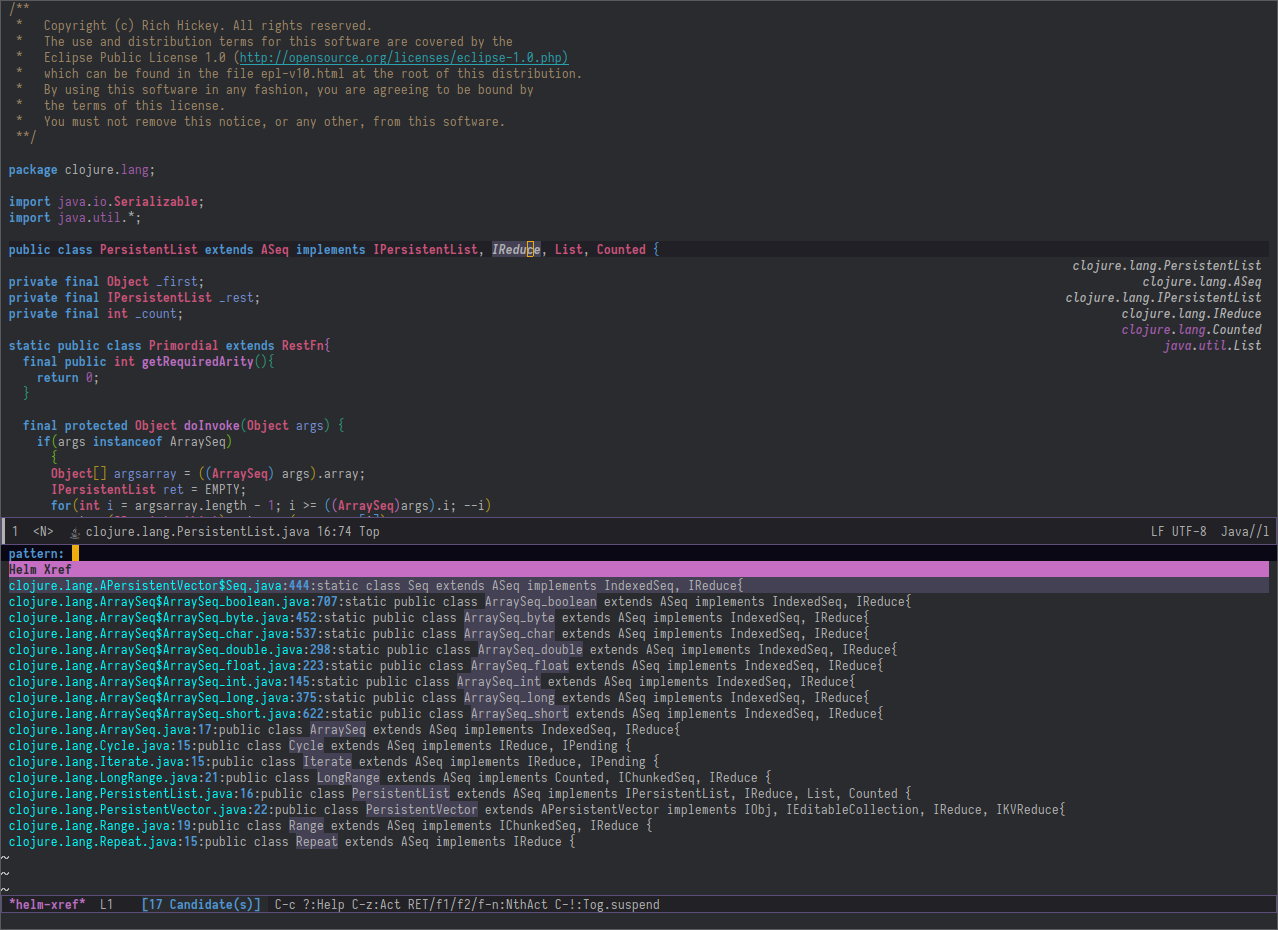
C-u-M-x-lspwhich will prompt you to select a server to start, selectjdtlsserver. Once the server has started(the initialization may take some time since JDT LS is downloading sources) you may callxref-approposand open type a Java Type likeArrayListorPersistentList. When you are in java file you can inspect documentation, look for class implementations, references and so on. - Invoke
xref-apropos, type a Java class name and then you can set breakpoints, go to definitions, find references, etc.
Implementations of clojure.lang.IReduce#
Debugging#
- Configure cider to start nrepl with remote debugging enabled and do
cider-jack-in
(setenv "JAVA_OPTS" "-Xdebug -Xrunjdwp:transport=dt_socket,server=y,suspend=n,address=1044")
- Call
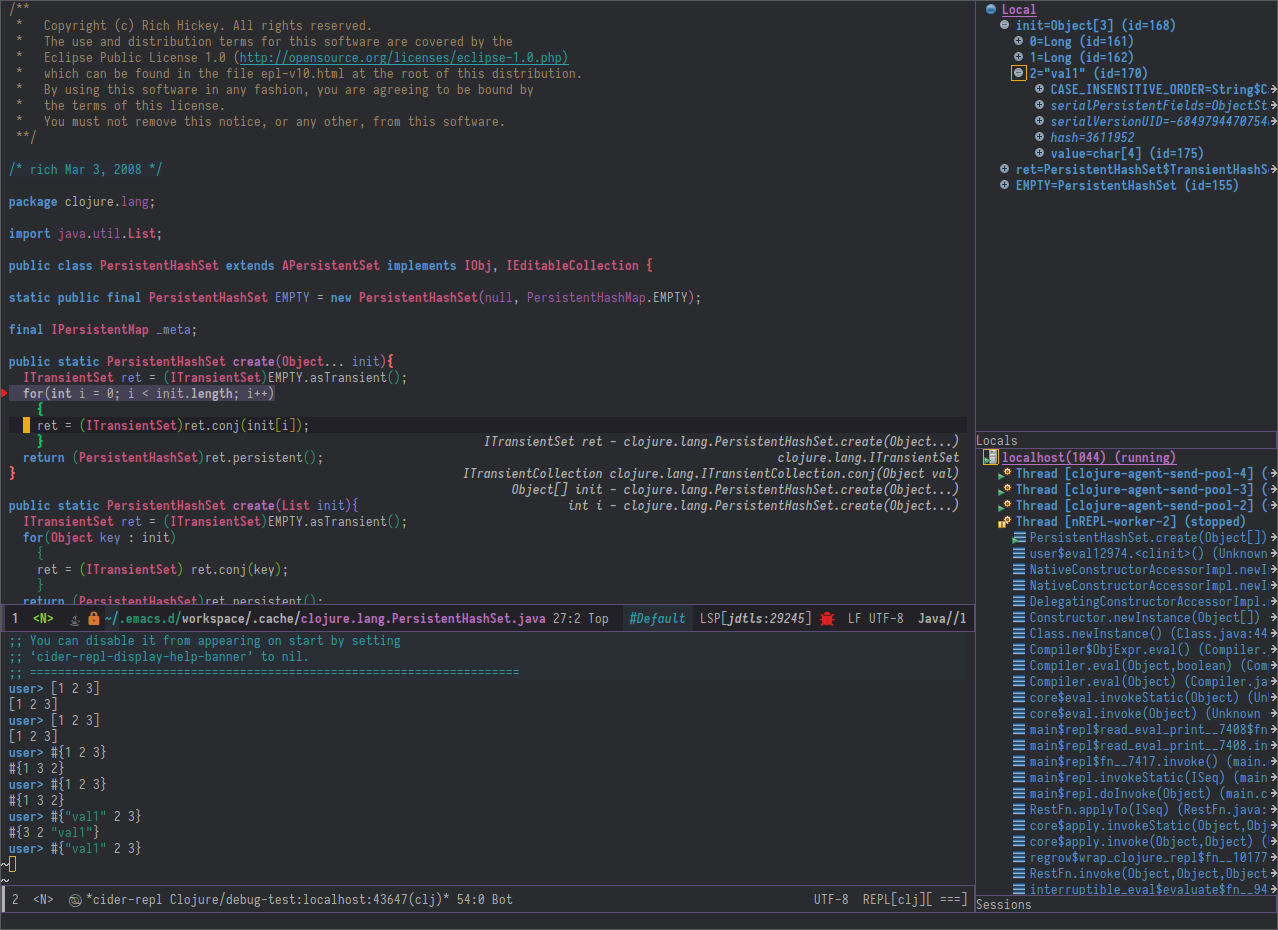
dap-debugand selectJava Attach configurationand enter port 1044 (the same port as the port above.). - Go to java class and place a breakpoint using
dap-breakpoint-toggle.
Debugging in progress#
Last update:
June 19, 2026